Kubernetes Cheat Sheet
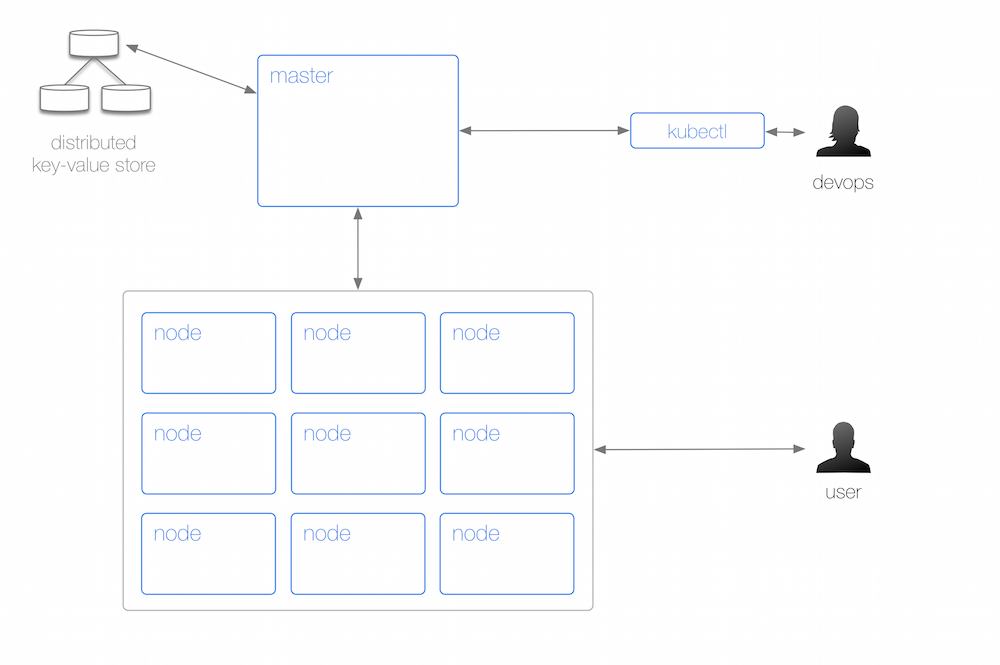
Physical Layout
Query the server/client version used:
kubectl version
Get cluster info:
kubectl cluster-info
Get configuration info:
kubectl config view
Watch nodes continuously:
kubectl get nodes -w
Get info about 'node123':
kubectl describe node123
From a physical perspective, a Kubernetes cluster consists of:
- A master (with several independent sub-components, details below) that coordinates the work.
- A distributed key-value store, currently etcd, for maintaining the resource state in a persistent and reliable manner, throughout the cluster.
- A number of nodes that carry out the work.
- A command line tool called
kubectlallowing to query and manipulate the cluster state; this is a fancy way of saying: running containers, creating services and administrating the cluster (logging, monitoring, debugging).
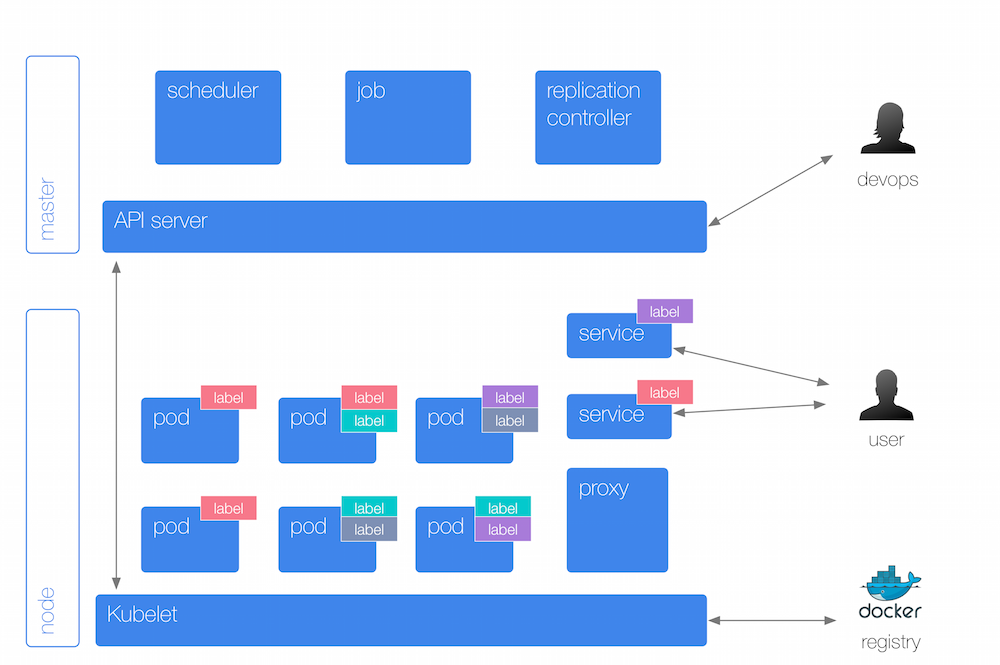
Abstractions Overview
List pods:
kubectl get pods
Get info about pod 'nginx-hl2nb':
kubectl describe pod nginx-hl2nb
List replication controllers:
kubectl get rc
Get info about replication controller 'nginx':
kubectl describe rc nginx
Expose replication controller 'nginx' as a service on port 80:
kubectl expose rc nginx --port=80 --target-port=8000
List services:
kubectl get svc
Get info about service 'nginx':
kubectl describe svc nginx
Destroy/remove a resource :
kubectl delete pod nginx-hl2nb &&
kubectl delete rc nginx &&
kubectl delete svc nginx
Organize your resources
The primary organization mechanism in Kubernetes are so called labels: these key/value pairs allow you to tag any sort of resource such as a pod or a RC. Both the key and the value are transparent to Kubernetes, which is an elaborate way to say: Kubernetes doesn't know and doesn't care about it; labels only have a meaning to you. Kubernetes, however, will use the labels to, for example, select pods that belong to a service, select pods that a certain RC is supposed to look after, for rolling upgrades and to debug containers online.
Troubleshooting
In order to troubleshoot the cluster, you may wish to use the following commands:
- To debug a container, enter it so:
kubectl exec nginx-hl2nb /bin/sh(note: in this case the first container will be used, otherwise use-c $NAME_OF_CONTAINERto specify which container to enter) - To see the logs of a pod in a rolling fashion use
kubectl logs -f nginx-hl2nb(note: same as with exec, you can specify the container if you wish to) - The Kubelet logs are per default at:
/var/log/kubelet.log - To check the status of components such as the scheduler, etcd, and controller manager use:
kubectl get cs
Abstractions Details

The interactions are as follows:
- A replication controller (RC) looks after one or more pods. The RC keeps a number of pods (so called replicas) up and running.
- To launch a pod and implicitly create a RC:
kubectl run ubuntu --image=ubuntu - To create a RC from a manifest, use:
kubectl create -f nginx-rc.yaml. See the YAML formatted RC manifest file itself for the actual definition. - To list all RCs in a certain namespace:
kubectl get rc --namespace="kube-system" - To change the number of pods in a RC, scale it like so:
kubectl scale --replicas=2 rc nginx - Containers in a pod may use ephemeral local disk space but for sustainable, persistent scenarios as well as sharing data between containers in a pod you can use volumes.
- Implement health checks via
readinessProbeandlivenessProbefields on the pod-level.
- To launch a pod and implicitly create a RC:
A service represents a logical group of pods (backed by a RC). It provides a stable interface to interact with the pods. To create a service from a YAML file, use:
kubectl create -f my-service.yaml. The service selects the targeted pods it routes traffic to via labels, for example, to list all pods labelled with 'app=webserver' use:kubectl get pods -l="app=webserver".From either the end-user perspective or other services in a cluster, one interacts with a service. To expose a RC named 'nginx' that has a pod serving on port 8000 as a service on port 80, use
kubectl expose rc nginx --port=80 --target-port=8000. Also to list the endpoints, use:kubectl get epOn each node a local proxy runs that provides for basic service discovery and load balancing.
A container in a pod may use one or more secrets to handle sensitive information such as passwords or API credentials. To list all secrets, use:
kubectl get secretsA autoscaler is available on a per-RC basis. It scales the replicas depending on the average CPU utilization of the RC's pods.
For batch workloads, you can use jobs. To view completed pods of a job, use:
kubectl get pods --show-allChanges to resources such as pods, RCs, services, etc. are available through events:
kubectl get eventsTo separate users, groups or applications use namespaces.To list all namespaces, use:
kubectl get nsand to see the resource quotas of a namespace usekubectl get quota. When a pod doesn't specify its resource constraints such as CPU shares or memory requested it effectively can consume unbounded resources. You really want to specify default limits along with the quotas. Note: while quotas work on the namespace-level for, say, entire groups of users or projects, the limits work on a per-pod level.